Go Back
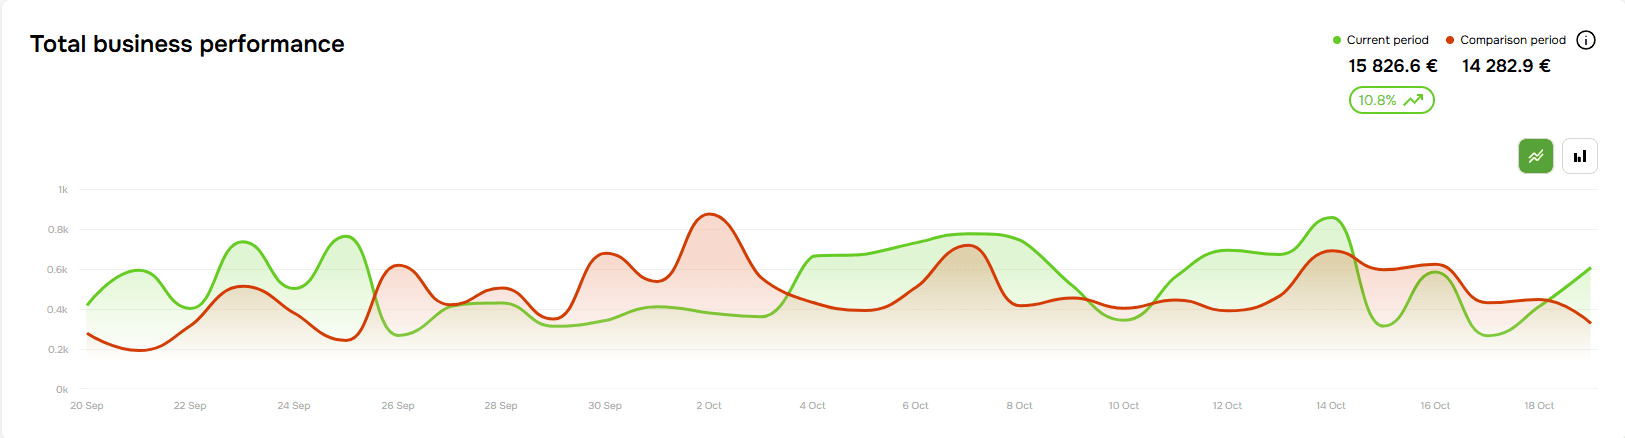
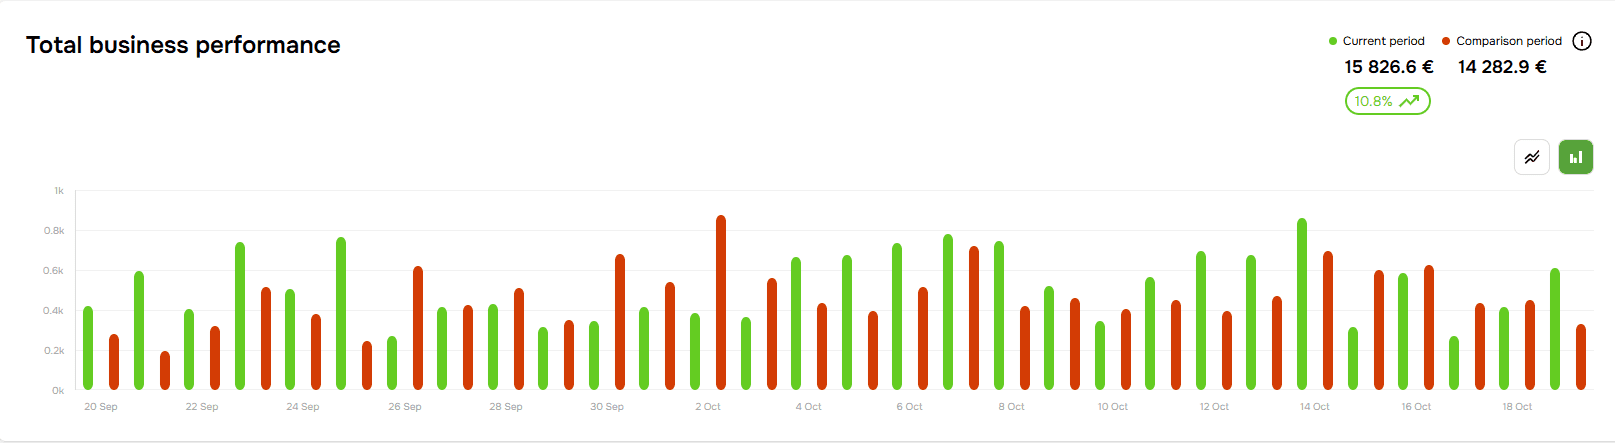
Total business performance

Provides a clear comparison of sales between the current period and a comparison period. It uses a bar chart to display daily sales trends visually, showing how performance fluctuates over time. The total sales amount is highlighted, along with a percentage increase or decrease from the previous period, offering insights into sales growth or decline. This helps users track progress and adjust strategies accordingly to optimize sales results.