Go Back
Overall campaign performance

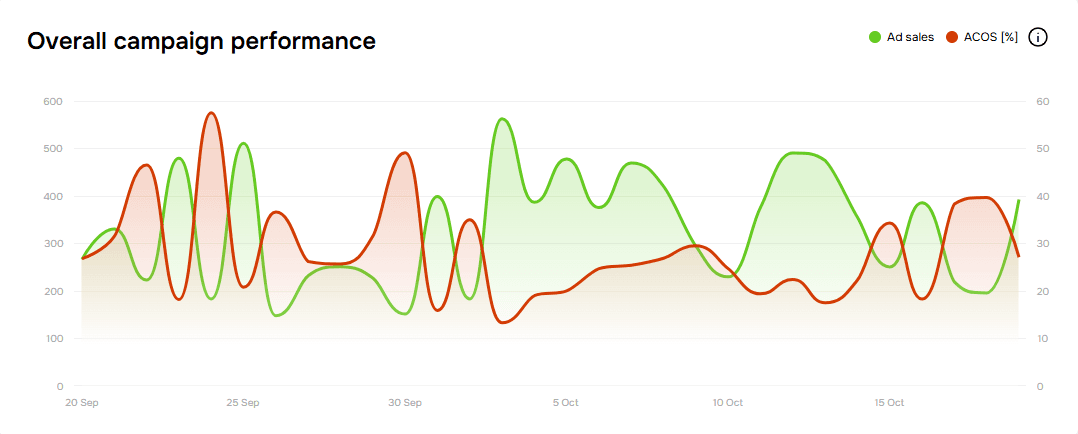
Provides an overview of the overall performance of your advertising campaigns, visualizing key metrics such as ad sales and acos over time. The bar chart displays the fluctuations in ad sales, while the line graph tracks changes in the advertising cost of sales (acos). together, these insights help you analyze the effectiveness of your campaigns, allowing you to optimize ad spend and maximize returns. By understanding these trends, you can identify high-performing periods and areas where adjustments may be needed to improve campaign efficiency.