Go Back
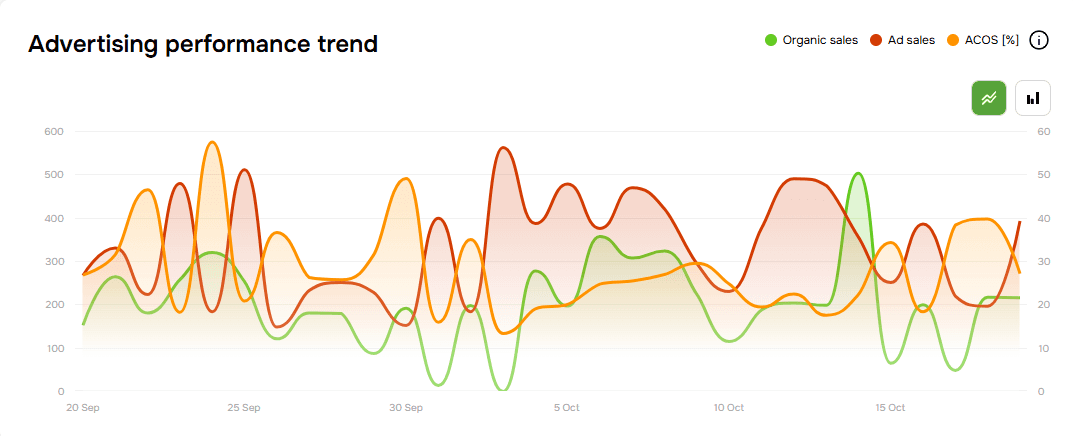
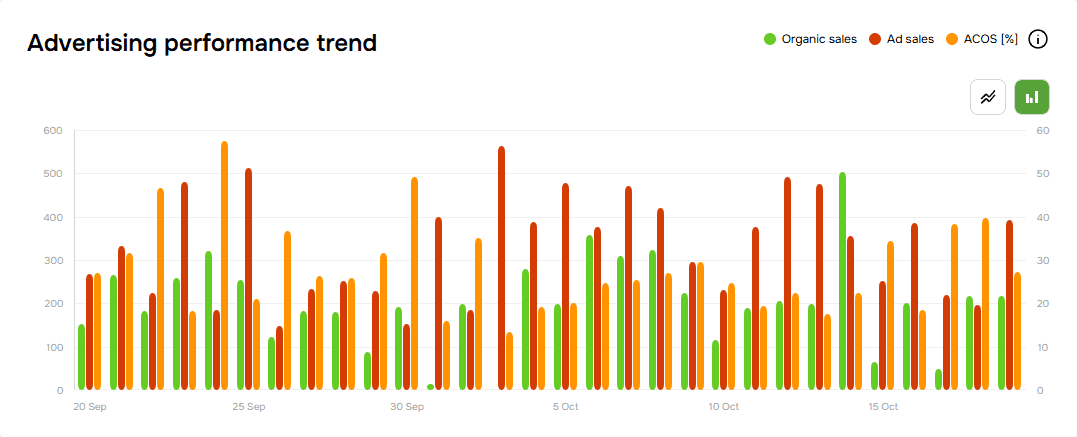
Advertising performance trend

Provides a visual representation of the relationship between ad sales and organic sales, with ACOS plotted as a line graph. The bars in the chart represent the daily amount of ad sales (blue) and organic sales (gray). ACOS (orange line) shows how efficiently ad spend translates into sales, with fluctuations indicating changes in advertising efficiency or campaign optimization efforts. This allows advertisers to track the impact of their advertising investments and adjust strategies to balance ad-driven and organic sales growth.